Q-Dashboard
User case
Q-Dashboard is designed as a tool for online monitoring of service performance parameters that are essential to the top management of all organizations.
In one comprehensive global view, the top management of a region or an organization as a whole can at a glance see the current (online) situation regarding queuing and servicing in all branches.
Functionality
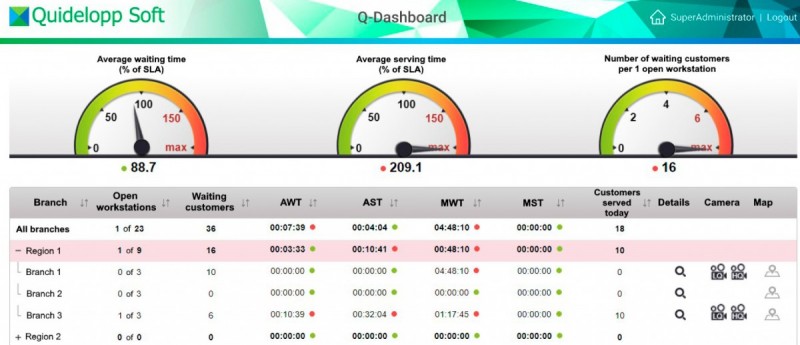
Q-Dashboard presents in one web interface comprehensive information regarding the status of all branches.
The branches accessible for an individual user is automatically defined by the corresponding access priviliges in Orchestra.
- Q-Dashboard presents the following information for each branch, and accumulated:
- Number of workstations open for servicing, out of the total available
- Number of waiting customers at the current moment
- Number of waiting customers per open workstations
- Average waiting time (AWT) accumulated during the current day
- Average service time (AST) accumulated during the current day
- Maximum waiting time (MWT) at the current moment
- Maximum service time (MST) at the current moment
- Customers served today
By selecting a specific line in the list, the speedometers presents graphcally the data for the selected line.
If a user wants more detailed information regarding a specific branch office, there is an option to see more details. When selecting ”Details”, Q-Dashboard automatically opens up the Management Information module for the selected branch (see separate description of the module Management Information).
Q-Dashboard can be integrated with a video monitoring system allowing for access directly from Q-Dashboard to a camera installed at the branch office for an online video translation of the physical situation in the branch office.
There is also an option for each user to set individual user preferences for the data presented.

